In September 2025, we published Wishful Thinking, Statistics, and Modeling, a deliberately optimistic attempt to model where TerraMatris could be a year later. Its starting value was $10,500. The headline possibility was a portfolio of roughly $24,000 by September 2026.
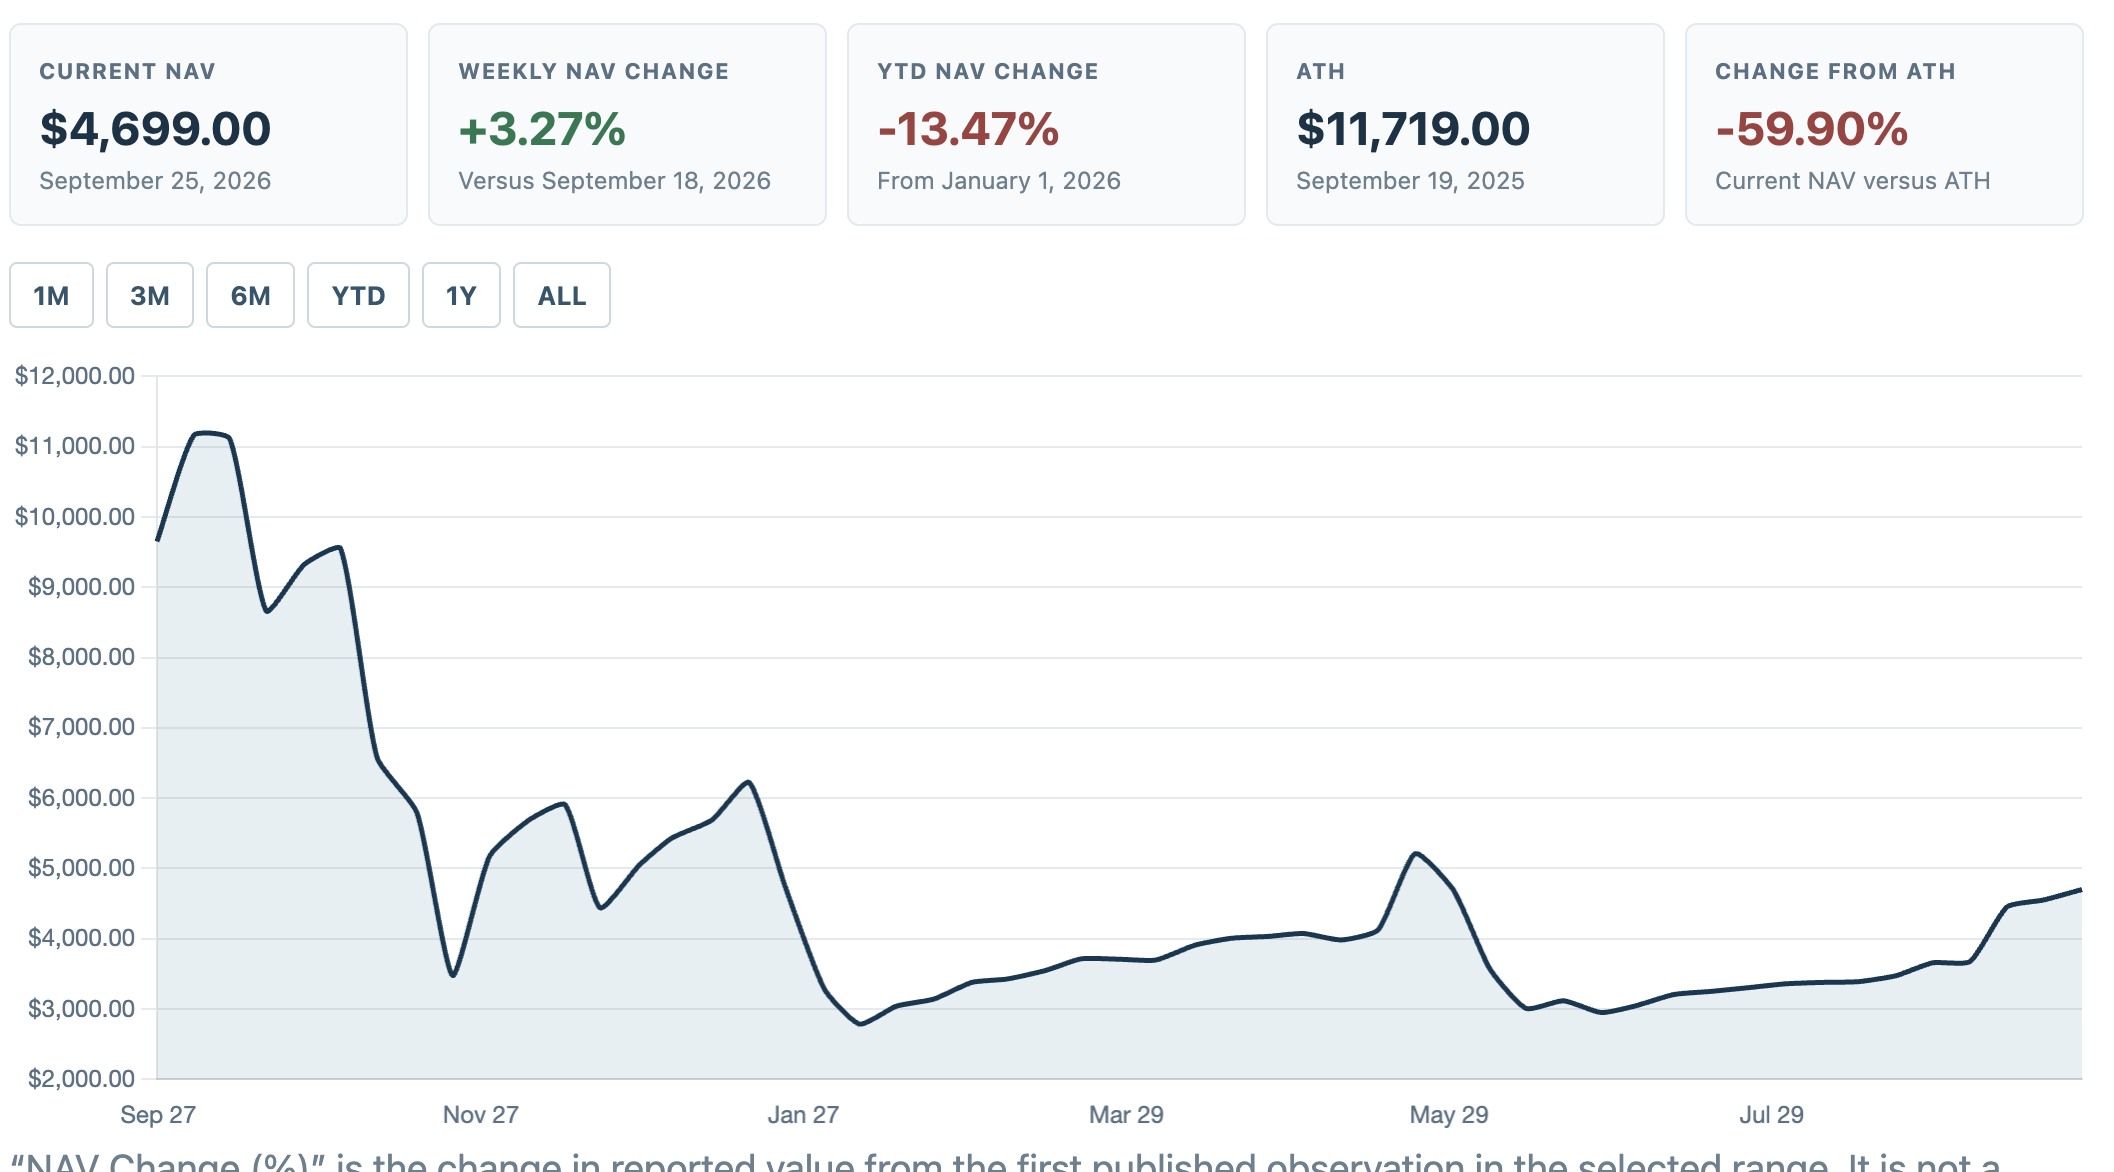
A year later, I am not interested in defending that estimate. I want to compare its premises with what we actually experienced in the portfolio. The latest public Trading Journal report available at the time of writing, dated September 25, 2026, records TerraM Multi Asset at $4,699. That is down 55.25% from the $10,500 starting figure used in the old model, and 59.90% below the $11,719 peak reached in September 2025.
This is an annual review, not a revised promise. The purpose is to identify where a smooth spreadsheet obscured real portfolio constraints, then set out conditional September 2027 scenarios that are more honest about drawdowns, execution and uncertain capital deployment.
What the old model assumed
The 2025 article made several explicit assumptions:
- regular weekly options income of $150, with a $300 end-of-month week;
- a recurring pattern of three or four regular weeks plus one stronger week every month;
- 10% monthly growth in both income assumptions;
- $17,133 in total options premium from September 2025 through August 2026, versus $9,600 in a linear no-growth case;
- full reinvestment of premiums;
- repayment of approximately $3,500 of debt by April 2026; and
- a resulting September 2026 fund value of about $24,000.
The article did include a warning that premiums could fall and drawdowns could force adjustments. But its structure still treated the premium rhythm as sufficiently stable for compounding to do most of the work. The phrase “if nothing changes” was the hidden assumption. In live crypto options management, conditions change constantly.
The projection also implied a 128.57% increase from $10,500 to $24,000. It assumed that a premium collected in one week would remain available to reinvest in the next. It did not model losing periods, adverse assignment, rolling costs, margin pressure, underlying-asset losses, the possibility that capital would be tied to an open position, or capital allocated outside the core portfolio.
What actually happened
The public Performance record contains 56 weekly Trading Journal observations from September 5, 2025 through September 25, 2026. It shows a very different path from the original model:
| Metric | Previous model | Public result through Sep. 25, 2026 | Difference |
|---|---|---|---|
| Starting portfolio value | $10,500 | $10,500 model baseline | — |
| September 2026 portfolio value | about $24,000 | $4,699 | -$19,301 |
| Year-on-year NAV change | +128.57% | -55.25% | -183.82 percentage points |
| Modelled options premium | $17,133 | $6,903.56 gross recorded option premium across public entries | -$10,229.44 |
| Peak public fund value | not modelled as a risk limit | $11,719 | — |
| Lowest public fund value | not modelled | $2,782.69 | -76.25% from peak |
The $6,903.56 is the sum of weekly Options premium entries across those public records. It is gross recorded option premium only: not realized investment profit, not portfolio return, and not an audited cash-flow figure. The entries are not a complete reconciliation of commissions, option buybacks, roll debits or credits, realized losses, taxes, debt service, capital transfers, or external contributions and withdrawals. NAV is the broader mark of the portfolio; the premium field is one input, not a substitute for it.
The path matters as much as the endpoints. The September 19, 2025 record recorded the $11,719 high alongside $160 in weekly premium.
Less than a month later, the October 17 report recorded NAV of $8,661 after a 22.08% weekly decline, while the Performance record still showed $277 of gross premium. By November 21, the record-loss report put NAV at $3,474.51 with $102 of gross premium recorded for that week.
There was a recovery to $6,224.81 in mid-January 2026, followed by the $2,782.69 low on February 6.
The September 25, 2026 report records the recovery to $4,699. These observations do not establish causal attribution, but they show the essential point: positive gross premium can coexist with sharply deteriorating NAV when underlying losses, leverage and position-management costs dominate.
Where the model was wrong
I treated premium collection too much like portfolio return. That was the central error in my earlier model.
Option premium is received when an option is sold. It is not automatically realized profit, and it does not prevent the underlying asset from falling. A premium can reduce a position’s break-even or create cash flow, but a deep move in ETH, BTC or SOL can dominate a small premium. A roll may show a credit while leaving the position open and capital committed. An assigned short put can turn cash collateral into an underwater spot holding. A covered call can generate income while limiting upside or forcing a decision about whether to let the asset be called away.
The 2025 model was also too smooth. Its $150 regular-week and $300 high-week cadence did not include weeks in which deployment had to be reduced, positions were managed rather than freshly opened, or capital was consumed by defensive action. The record contains a counterexample: the $277 gross-premium entry in the October 17 report sat beside a 22.08% weekly NAV fall. The public record also has high premium weeks, including $582 on August 29, 2025, but much smaller figures during the 2026 rebuild: $7.74 on July 3, $15.21 on June 12 and $36.46 on September 25. A high-premium observation was not a reliable base rate for a whole year.
The February capitulation and reset made the capital-efficiency issue explicit. The portfolio had accumulated leveraged ETH and short-put exposure. When ETH fell below $2,000, deeply underwater exposure, margin and forced deleveraging mattered more than the premiums already booked. The portfolio was simplified and leverage was closed, but that reset realized losses and reduced the capital base available for later compounding.
The strategy mix also changed. We did not spend the year continuously scaling one stable weekly engine. We moved through multi-asset exposure, a reset toward spot-first ETH, and then a more deliberate covered-call focus. BTC is now part of the current TerraM Multi Asset direction alongside ETH, but Solana remains a separately operated TerraMatris strategy, not a current Multi Asset allocation. SOL could join Multi Asset later, or remain separate; that allocation decision has not been made. The September 25 report illustrates why the boundary matters: BTC was rolled higher and further out to retain the underlying, while 15 SOL were allowed to be called away because a deep-ITM roll was unattractive. Those are operational changes, not a frictionless increase in position size.
Crypto volatility both helped and hurt. It produced premium when options could be sold at attractive terms, but it also drove the asset moves that made positions difficult to hold, roll or replace. The recent SOL liquidity review describes the practical difference between a listed expiry and an executable roll. In the September 25 report, 15 SOL were called away because rolling deep in-the-money calls was unattractive; BTC exposure was rolled higher and further out, tying up the same underlying for weeks. Those are real constraints on continuous deployment.
We also cannot verify from the public archive a clean series for capital additions, withdrawals, debt payments, or every allocation to TerraM liquidity and buybacks. The old forecast assumed debt repayment and full reinvestment. The public weekly fund-value and premium fields do not identify those cash flows separately, so a precise attribution of NAV change to trading versus financing would be invented. This review does not make that claim.
What went better than expected
The original thesis was not wrong about every point. A repeatable options process can create useful cash flow. The September 25 journal entry documented ETH and BTC gross option premium, reinvestment into small underlying positions, and separate strategy work in SOL. The portfolio remained operational through a difficult year and recovered from its February low by 68.87% by September 25.
The clearer positive is not a number. It is that the strategy is now better separated into ETH, BTC and SOL work, each with its own collateral, liquidity and assignment issues. The Strategies page documents that separation. A smaller, more explicit process is more useful than a large number generated by compounding a single good month.
Lessons from one year of live management
First, NAV growth, options premium, realized profit, unrealized gains and losses, and contributions or withdrawals are different measures. A future report should continue to label them separately.
Second, capital is not always free to compound. It can be collateral for a short put, locked behind a covered call, tied to a roll, or unavailable because the prudent decision is to reduce size.
Third, a premium target should not be annualized without a clear denominator, a realized-P&L reconciliation and an account of the risk assumed. The earlier portfolio experienced a 76.25% peak-to-trough decline. That drawdown is more informative about the model than an annualized premium figure.
Finally, diversification across BTC, ETH and SOL can create more opportunities, but it also creates more distinct execution problems. It does not remove crypto beta, liquidity risk, correlation during stress, or the chance that a position’s best risk decision is to close it rather than keep producing income.
Starting point: September 2026
The starting NAV for the new model is $4,699, the public TerraM Multi Asset value dated September 25, 2026. This is not a claim that every asset, sub-strategy or external allocation is included in exactly the same way; it is the current comparable headline record used in the public archive.
The scenarios below assume no new external capital and no withdrawals because neither can be verified prospectively. They use rounded annual portfolio-growth assumptions rather than compounding a weekly premium number. The gross monthly premium figures are operating assumptions, not additions to the growth figures. They are included to show the intensity of activity required, not to double-count revenue.
Current run-rate, historical average and prudent modelling
The recent public records show the relevant distinction. The ETH strategy recorded about $39 in gross premium in Ep. 160, about $35 in Ep. 161, and $29.26 from the new ETH short-put position in Ep. 162. The latter report also recorded an $8.71 gross BTC roll credit, for $37.97 in manual ETH-and-BTC gross premium before commissions.
A current operating cadence around $40–$50 a week, when positions can be deployed, makes roughly $160–$200 a month in gross option premium attainable under similar conditions.
That is not a $2,400 annual NAV-growth assumption. Gross premium can be reduced or offset by option buybacks and closing costs, debit rolls, assignment, idle collateral, periods without a suitable trade, underlying-price losses, and allocations after a cycle is actually realized.
The current policy can also direct 50% of completed realized ETH-cycle profits toward TerraM liquidity and buybacks, rather than leave all capital available for the core strategy. The historical $6,903.56 public-entry total is also much broader and more uneven than the current ETH run-rate. For these reasons, I use gross-premium ranges below as operating context, while the NAV scenarios remain deliberately independent, whole-portfolio outcomes.
One separate capital-allocation possibility is under consideration: adding approximately 0.01 BTC to the TerraMatris portfolio each month, potentially through the Bitcoin Strategy. It is not a commitment and may not materialize. If it did occur for 12 months, it would represent 0.12 BTC of gross additions. No future dollar value is assigned here because that would require a BTC-price assumption rather than an observed contribution amount. A regular BTC contribution could make the portfolio materially larger by September 2027, but that difference would mostly reflect contributed capital rather than strategy performance. For that reason, the three scenarios below deliberately exclude new capital and remain like-for-like NAV models.
TerraM activity is another possible source of capital entering the wider TerraMatris ecosystem. TerraM OTC sales, broader ecosystem activity, or other legitimate token-related inflows may occur, but they may be irregular or may not materialize at all. They are not strategy-generated investment performance and are not included in the three core NAV scenarios. Like a BTC contribution, an actual token-related capital inflow could change nominal portfolio size without showing that the strategy generated that difference.
| Scenario | Starting NAV | Assumed 12M NAV change | Modelled Sep. 2027 NAV |
|---|---|---|---|
| Conservative | $4,699 | -20% | $3,759.20 |
| Base / realistic | $4,699 | +15% | $5,403.85 |
| Strong | $4,699 | +35% | $6,343.65 |
Conservative: another difficult market
This scenario retains approximately $80 of gross option premium in an average active month as a deliberately discounted modelling assumption, not the current weekly run-rate annualized. It assumes intermittent rather than continuous deployment, no additional capital, and a 20% NAV decline. Any realized cycle profit is assumed to be split under the stated policy: up to 50% may be directed to TerraM liquidity or buybacks, leaving less to reinvest in the core strategy. That allocation is not treated as a guaranteed benefit to NAV.
This outcome could follow a renewed ETH, BTC or SOL drawdown, assignment at poor levels, limited liquid rolls, lower volatility after positions are opened, or periods when collateral must remain defensive. It is conservative because it accepts that premium may not offset asset losses.
Base / realistic: modest recovery, not a return to the high
The base case uses roughly $160 gross premium per active month, the low end of the current $40–$50 weekly operating cadence, while still assuming that not every week is deployable. Profits are reinvested only after positions are closed and risks are reconciled; no external capital is assumed; and the NAV outcome remains a 15% increase. Any TerraM-related allocation comes only from completed realized cycle profits, not from borrowed capital, OTC-sale assumptions or assumed paper gains.
A $5,403.85 modelled NAV would still be 53.89% below the September 2025 high. It therefore does not assume that a modest recovery repairs the prior drawdown. It requires disciplined ETH, BTC and SOL activity, but not perfect deployment or a one-way crypto market.
Strong: constructive markets and clean execution
The strong case uses approximately $200 gross premium per active month, near the upper end of the present $40–$50 weekly run-rate, a larger share of completed profits reinvested after any TerraM allocation, no new capital, and a 35% NAV increase. It requires supportive but volatile-enough markets, limited adverse assignment, usable liquidity for the active ETH and BTC positions, and no repeat of the leveraged stress that required the February reset. It does not assume that SOL has joined Multi Asset.
At $6,343.65, this would be a meaningful recovery from today, but it would still sit 45.87% below the $11,719 historical high. Calling it “strong” is not the same as calling it likely. It is a conditional model.
What could derail all three
All three scenarios can fail. The September 2027 number is not the point; the variables behind it are. These include ETH option income and price, BTC strategy performance, whether a monthly BTC contribution happens, leverage and available collateral, assignments and rolls, volatility, deployment opportunities, TerraM liquidity allocations or buybacks, possible TerraM OTC sales and broader demand, other capital additions or withdrawals, strategy changes, and the unresolved decision about whether SOL ever joins Multi Asset. A severe crypto drawdown could make premium small beside underlying losses. A sharp rally can create the opposite problem for covered calls: capped upside, calls in the money and expensive or illiquid rolls. Short puts can be assigned into a falling market. A fall in implied volatility can reduce premium without making the asset safer. Margin, collateral needs, execution spreads, commissions, and deep ITM positions can all make a simple weekly model unreliable.
There is also a governance issue. If capital is allocated to TerraM liquidity or buybacks after completed cycles, that can advance a separate ecosystem goal, but it reduces the amount available for core-strategy reinvestment. It should be reported as an allocation decision, not disguised as trading return.
September 2027: what matters more than hitting a number
The best outcome by September 2027 would not be a spreadsheet target achieved by smoothing away the bad periods. It would be a portfolio with a clearer NAV history, separate reporting for premium and realized P&L, disciplined collateral use, a documented treatment of contributions and allocations, and fewer assumptions that every week can be fully deployed.
The 2025 model was useful because it made my optimism visible. This review is useful only if I am equally clear about the errors. We can keep building a more resilient process around Ethereum and Bitcoin, while operating Solana separately unless and until an explicit Multi Asset allocation is made. I will judge the next year by risk-adjusted process, transparent records and survival through difficult markets—not by treating premium as a promise of compounding.
This article is a historical review and scenario exercise, not investment advice, a performance promise, or an offer to manage capital. Crypto assets and options involve substantial risk, including loss of principal. Historical premium, NAV and scenario figures do not guarantee future results.